Update: UMN Data Viz Competition Winners Announced
Congratulations to the following winners of the UMN Data Viz Competition, who will go on to represent the University of Minnesota Twin Cities campus at the BTAA Data Viz Championship on Friday, February 16.
Student Category Winner:
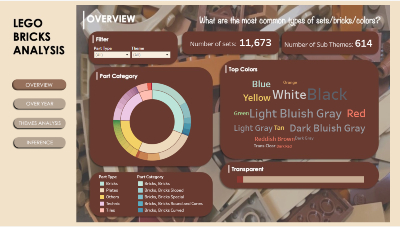
Lego Bricks Analysis
Author(s): Khanh Chi Le
This data visualization analyzes Lego Brick Data from 1950s to 2010s to address 4 big questions: Most Common Types (Overview), Evolution over Time (Over Year), Theme Overlaps and Differences (Themes Analysis), Inference about Target Audience (Inference).
Faculty/Staff Category Winner:
Terpene emissions from Pondersa Pine needles in 2021, illustrated through abstract paintings
Author(s): Lindsy Halleckson, Dylan Millet, Mj Riches (CO State Univ)
I am a staff member at the UMN, but I am also an artist. In 2020-2022, I was invited to participate in a collaborative NSF research project with Dr. Dylan Millet's lab in Atmospheric Chemistry in order to fulfill NSF's Broader Impacts section. Through animating data gathered during their research through paintings, I helped share their findings with the broader community.
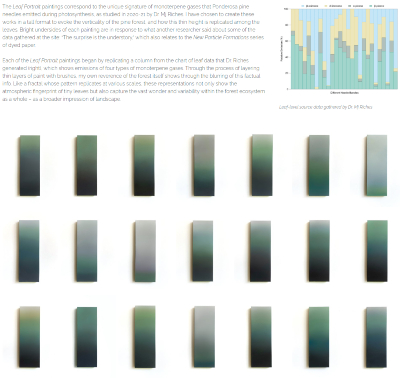
The 'Leaf Portrait' paintings correspond to the unique signature of monoterpene gases that Ponderosa pine needles emitted during photosynthesis, as studied in 2020-21 by Dr. Mj Riches (Colorado State University) during the NSF collaborative project with the Millet lab (UMN).
Each of the 27 Leaf Portrait paintings began by replicating a column from the chart of leaf data that Dr. Riches generated, which shows emissions of four types of monoterpene gases. Through the process of layering thin layers of paint with brushes, my own reverence of the forest itself shows through the blurring of this factual info. Like a fractal whose pattern replicates at various scales, these representations not only show the atmospheric fingerprint of each needle but also capture the vast wonder and variability within the forest ecosystem as a whole – as a broader impression of landscape.
The Big Ten Academic Alliance (BTAA) has launched a Data Viz Championship to celebrate International Love Data Week and showcase data visualization talents of students, faculty, and staff. The University of Minnesota is participating in the Data Viz Championship and hosting an internal competition that is open to undergraduate and graduate/professional students, faculty, and staff from all campuses. All entries will be judged and the top visualizations will be featured during Love Data Week. In addition, the top visualizations from UMN-TC, which is a BTAA member, will move on to the BTAA Data Viz Championship.
Requirements For Students:
The challenge is to use the Lego Brick Database, published on Kaggle, to devise a data visualization to address the question(s) of your choice.
- The Lego Brick Database must be used, but additional data can also be used to supplement should students opt to do so
- Visualizations must be accessible via a link that requires no login at the time of the Challenge voting and judging
- Some sample research questions below, but you don’t have to be limited by them
- Students can collaborate together and all contributors must be credited; one person should be identified as the primary presenter
- Have fun and be creative!
Potential research questions:
- What are the most common types of sets/bricks/colors?
- How have Lego sets changed over time (e.g., number of bricks, type of bricks, colors, types of sets)?
- In what ways do the themes (basic, police, racing, licensed brands) overlap and differ from each other?
- What might we infer about the people for whom Lego are designed based on what we know about the sets and bricks themselves?
Requirements For Faculty and Staff:
Submit an existing visualization that is used by your institution to share information. Visualizations can pertain to the institution as a whole or to a specific initiative or population. Submissions should follow institutional data policies.
- All submissions must follow institutional data policies and guidelines
- Visualizations must be accessible via a link that requires no login at the time of the Challenge voting
- Faculty and staff can collaborate together and all contributors must be credited; one person should be identified as the primary presenter
How to Submit Visualizations
The deadline to submit visualizations was January 18, 2024.
2024 Love Data Week
Learn what data events are happening at UMN during 2024 Love Data Week